Oklahoma's Student Population is Growing ... and Changing
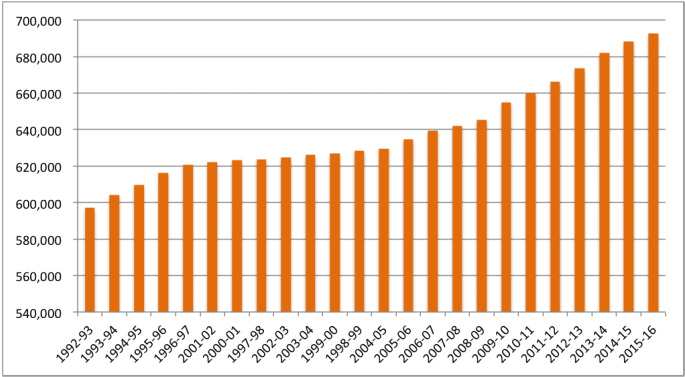
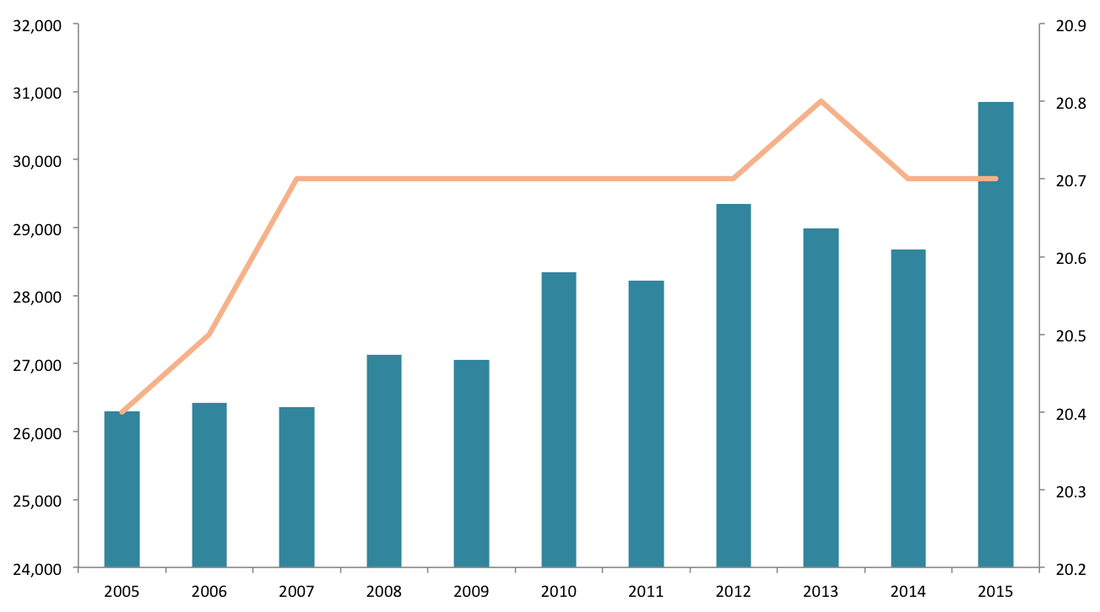
As student enrollment has grown over the last two decades, student needs have significantly increased. Despite the growing diversity, an increasing number of students are taking the ACT while the average score is holding steady.
Enrollment
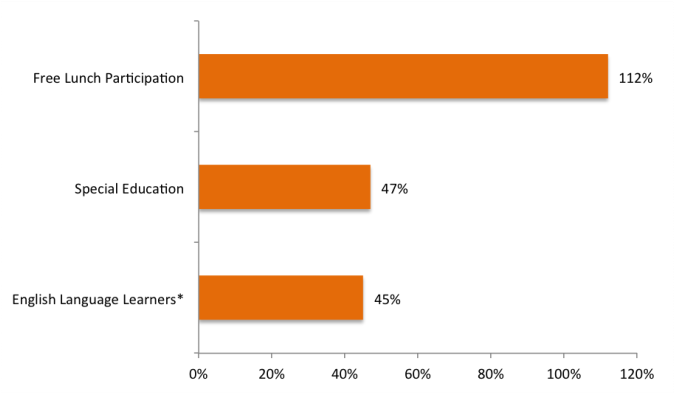
Growth in Student Needs
Source: National Center for Education Statistics, 1992-Present
*Data only available since 1998
*Data only available since 1998
Student Achievement
Oklahoma Students Taking the ACT & Average ACT Score
2005-2015
- 80% of Oklahoma high school seniors took the ACT in 2015 -- up from 75% a year before.
- 19% of those tested are potential first-generation college students.
- From 2011-2015, the number of ACT test-taking graduates increased 9.3%.
- Oklahoma's average ACT score is ranked 11th nationally among states where at least half of seniors take the test.
Administrative Costs & Staffing
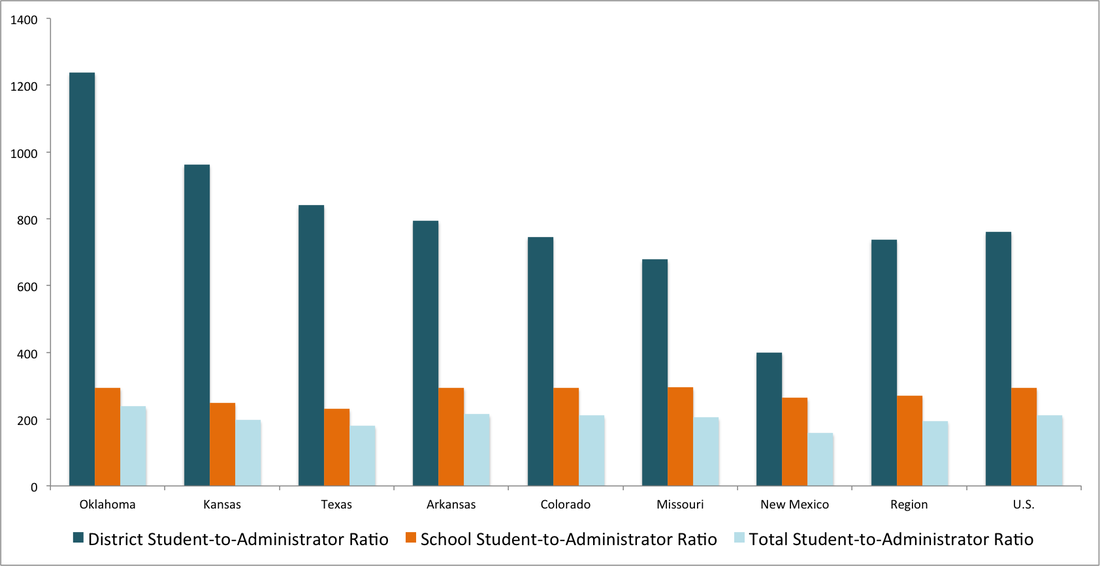
Are Oklahoma's schools top heavy? That's not what data shows. Oklahoma administrators are responsible for more students than most of their peers in other states. In fact, schools have adjusted staffing to meet new mandates and the growing needs of students.
All AdministrationBy the Numbers
Student-to-Administrator Ratio 238:1
|
District AdministrationBy the Numbers
Student-to-Administrator Ratio 1,238:1
|
School AdministrationBy the Numbers
Student-to-Administrator Ratio 295:1
|
Source: National Center for Education Statistics
Based on FY 12 data school staffing data (most recent available)
Based on FY 12 data school staffing data (most recent available)
Staffing
To meet student needs, public education has shifted its staffing significantly since 1992.
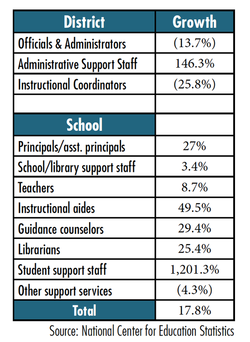
- There are fewer district-level administrators despite additional mandates.
- With the growth in students receiving free lunch, English language learners and children with special needs, schools have had no choice but to add additional employees to provide support.
- The largest area of staffing growth comes in two areas: instructional aides and support staff who provide direct services to students, including speech pathologists, audiologists and social workers.
- Schools also face many more mandates -- particularly in the area of testing -- than they did in 1992 that have required growth in some non-teaching areas.
- Enrollment increases in pre-kindergarten and full-day kindergarten also have increased the need for instructional aides.
Oklahoma Education Funding
The amount spent on public education in Oklahoma has grown but isn't keeping pace with enrollment. Common education comprises a shrinking share of the state's budget, and districts are increasingly reliant on local revenue sources. On a per-student basis, Oklahoma's surrounding states are investing hundreds of millions of dollars more in education.
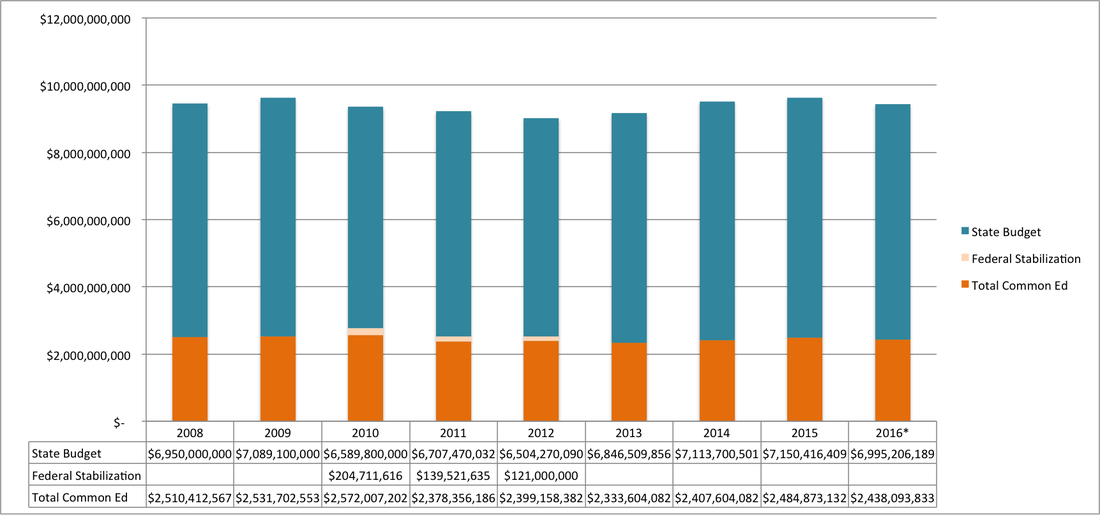
Education Funding: 2008-Present
State funding for common education is less in FY2016 than in FY2008.
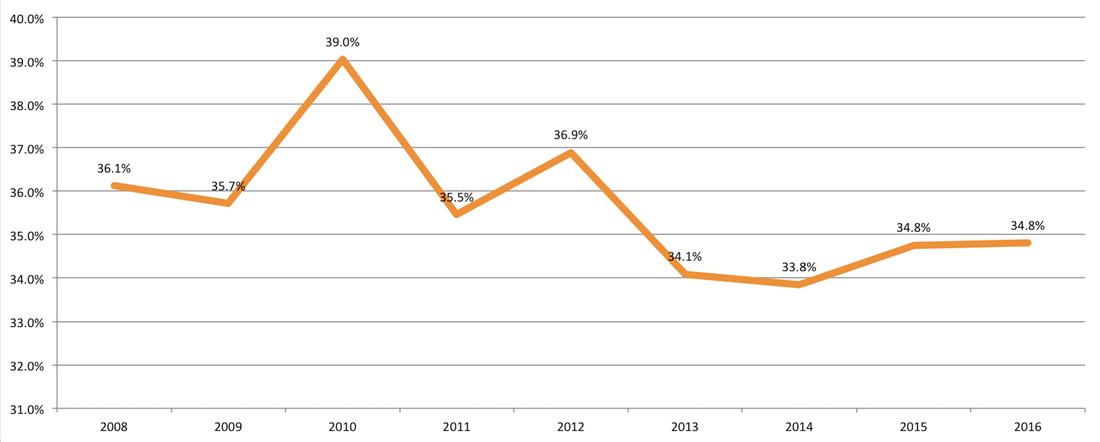
State Funding
Common education funding makes up a smaller share of the state budget than it did in 2008.
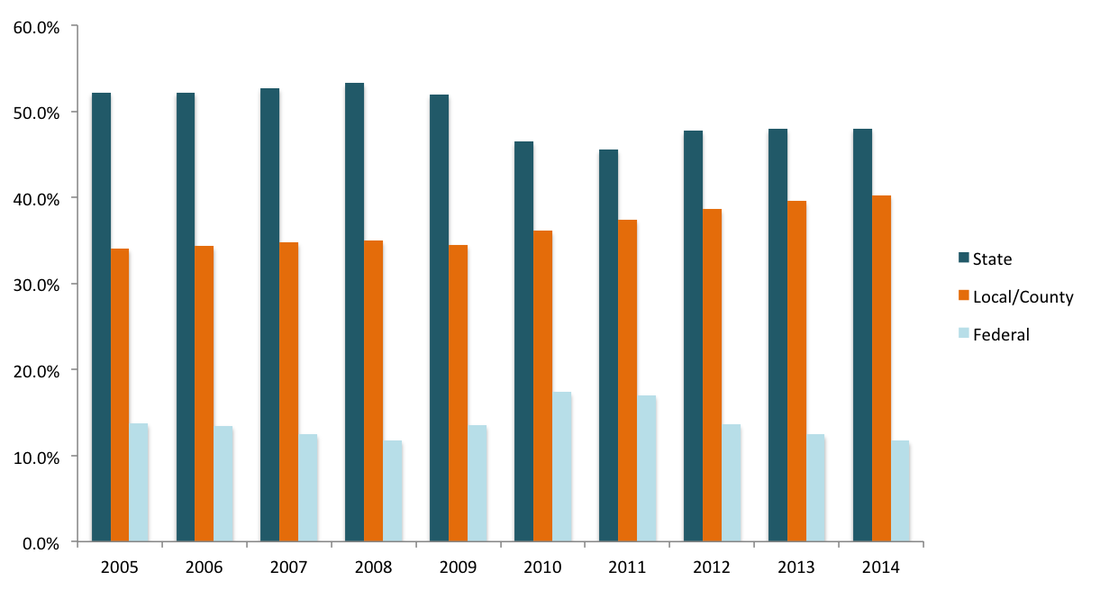
District Revenue Sources
School districts are relying more on local funding.
Source: Oklahoma Office of Educational Quality and Accountability, 2014 Profile
Education Investment Gap
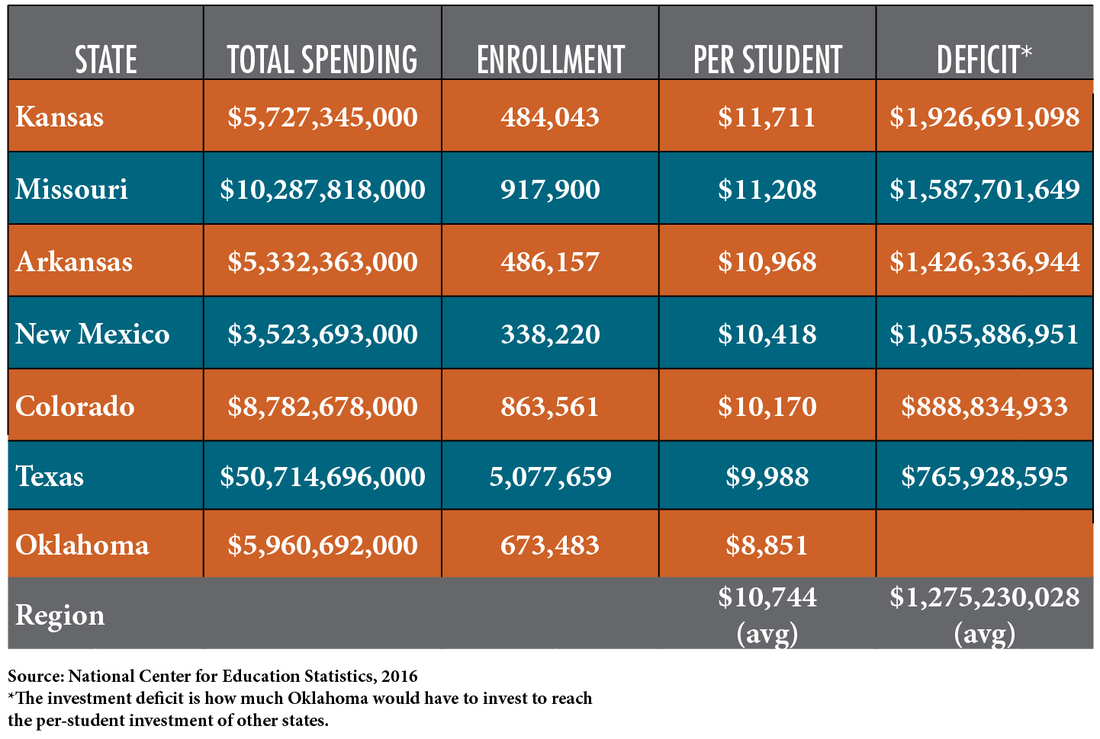
Oklahoma's neighboring states invest substantially more in common education on a per-student basis. Oklahoma would have to invest nearly $1.3 billion more annually to reach the regional average per-student spending.
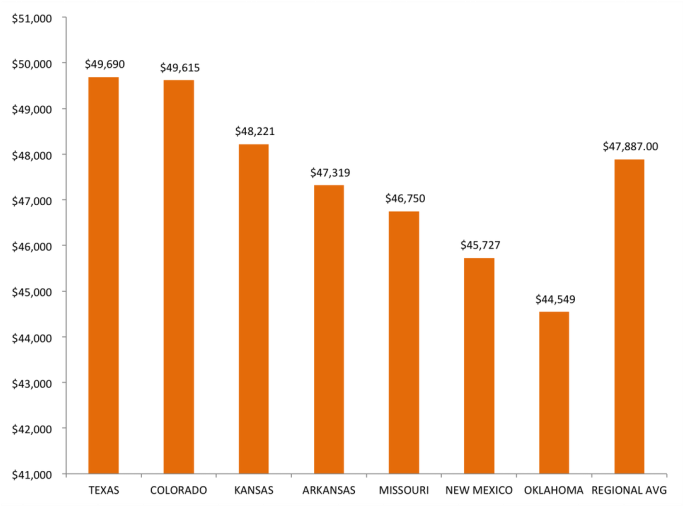
Average Teacher Salaries
Oklahoma's average teacher salary, which includes health benefits and the district's retirement contribution, is not regionally competitive.
Source: National Education Association
Teacher Shortage
Oklahoma schools are coping with a significant teacher shortage, which has led to increased class sizes and the elimination of some courses.
- Oklahoma started the school year 1,000 teachers short despite eliminating 600 teacher positions from the prior year.
- The state Board of Education has issued more than 1,000 emergency teaching certificates this year.
- About one-third of school leaders said their schools likely will offer fewer courses this school year.
- Special education, elementary, high school science, high school math and middle school math are the most difficult teaching positions to fill.
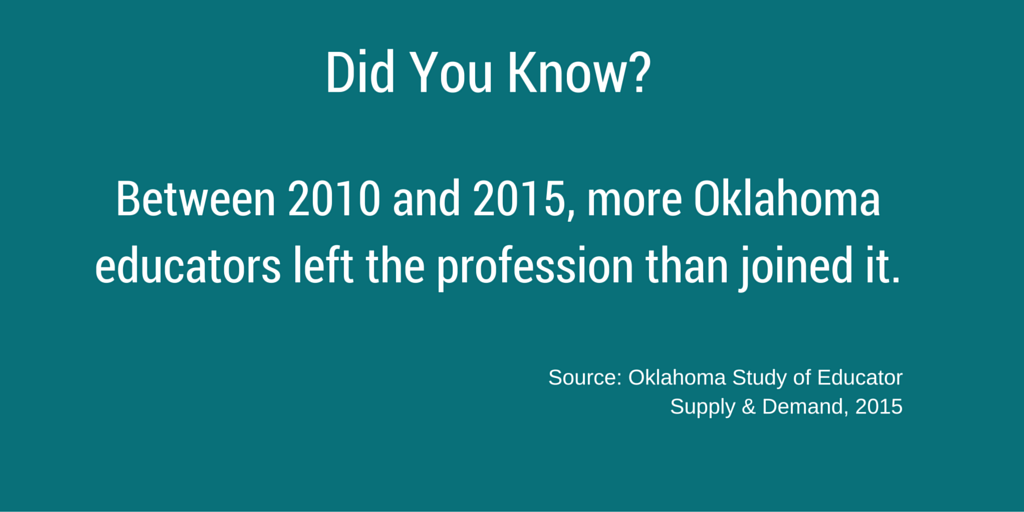
- 11 out of every 100 Oklahoma teachers leave the state or the profession every year.
- 17% of new teachers in Oklahoma leave the state or the profession after their first year.
- 10% of Oklahoma teachers with a decade of experience leave the state or profession every year.
- Oklahoma is replacing experienced teachers who leave with teachers who are far less experienced.
- Between 2005-2006 and 2013-2014, Oklahoma had a 24 percent decline in the number of students completing teacher preparation programs. Research has projected that it will further decline 22 percent between 2013-14 and 2018-19. (Student enrollment is projected to continue increasing).
- Oklahoma is not producing enough foreign language, math or science teachers to replace those who are leaving.
- The projected demand for teachers in Oklahoma will continue to outpace the supply.
- Oklahoma has significant competition from the private sector and from surrounding states.
- A high percentage of out-of-state students (76%) who completed teacher preparation programs in Oklahoma in recent years never worked in Oklahoma’s public schools.
- Oklahoma's special education student-to-teacher ratio is almost 23:1.
Sources: OSSBA, State Department of Education. An Empirical Analysis of Teacher Salaries and Labor Market Outcomes in Oklahoma and the Oklahoma Regents for Higher Education
